The Polyscope viewer from Python
The Polyscope viewer from Python: tensions and pressures on the tissue, saved figures, and a seed ensemble.
foambryo's viewer draws the mesh coloured by the inferred values, with a panel that shows their colour bars, which call produced them, a length scale bar, and controls to explode and cut the tissue, change the methods and recompute, change the background, and export the values. Every colour is computed by the library's own colour functions (foambryo.colour_scales), the ones the napari plugin uses too:
- tensions:
coolwarm, light grey at the mean tension (1 by default), blue below, red above, over a range centred on the mean; - pressures:
magma, light for low pressures, trimmed to its 10-90 % range so that no cell is drawn black or white; - an undetermined value (
nan) is green, and an undetermined tension's interface is drawn as its outline; crop faces are see-through glass with their edges.
This example generates a foam of Voronoi cells imaged with voxels of 1.0 x 0.5 x 0.5 um (not at mechanical equilibrium: the colours show the viewer, not the method's accuracy), and
- writes the colour bars without any window (
save_colour_bars: matplotlib only); - writes the viewer's first view of the tensions and pressures as a figure (
plot_force_inference(..., save_figure=..., show=False)), then of the tensions exploded, then of tensions averaged over four reconstructions with their seed spread (plot_tension_inference(..., seed_ensemble=...)). Saving a figure needs Polyscope and a display; the window closes once the figure is written; - with
--show, opens the same views as windows to explore (close each window to go on); -
with
--from-mask, opens the window on the mask itself (view_mask): the panel reconstructs it and infers, in separate processes, with their elapsed time, an estimate and Cancel. This is whatfoambryo view MASK --spacing DZ DY DXopens.pip install "foambryo[viewing]" python polyscope_viewer.py # writes ./polyscope-viewer-output/ python polyscope_viewer.py --show # and opens the windows python polyscope_viewer.py --from-mask # the window that starts from the mask
The script: Examples/polyscope_viewer.py. It needs only foambryo and foambryo[viewing]; it generates its own tissue.
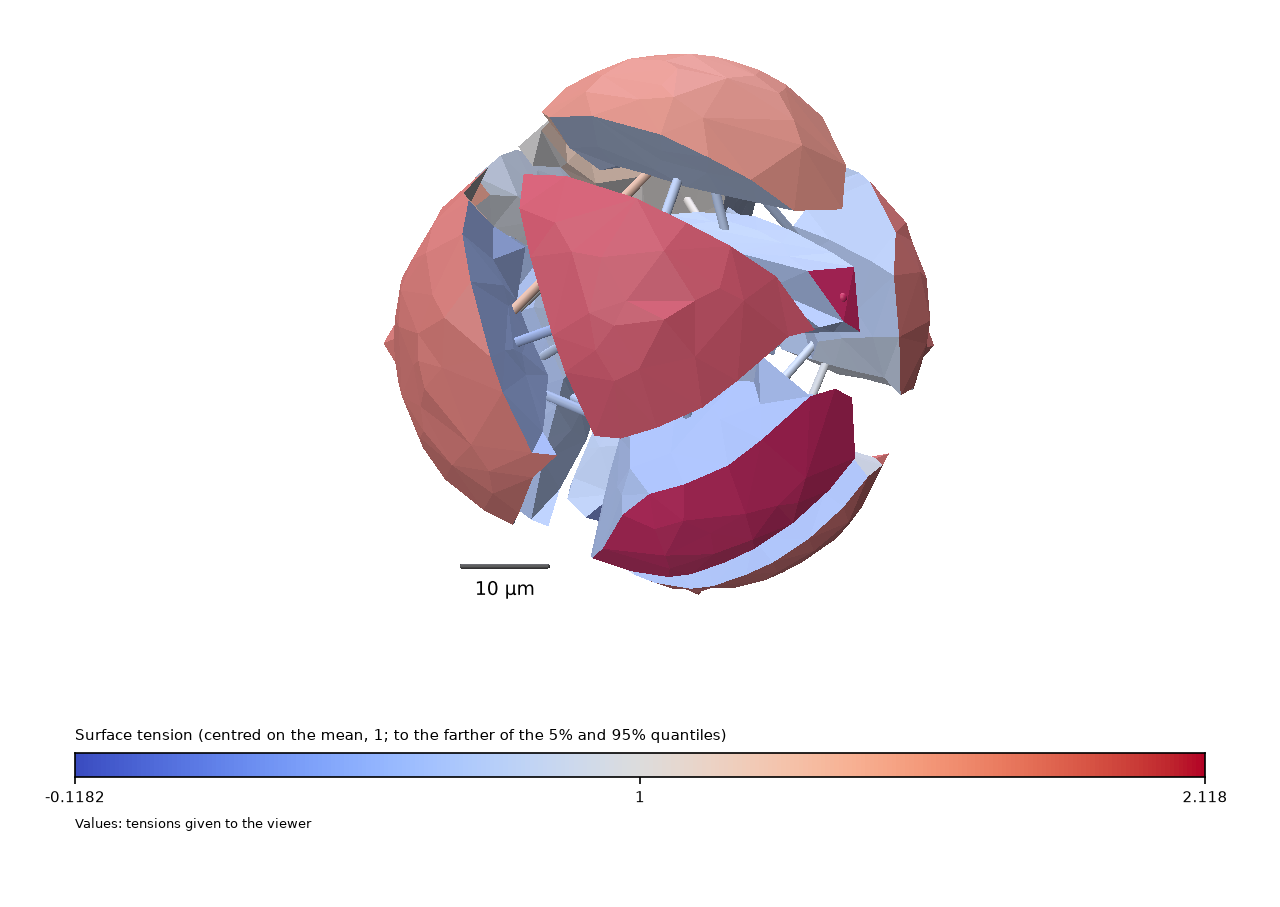
The figure plot_tension_inference(..., scattered=True, save_figure=...) writes: the generated foam's tensions, exploded, with the colour bar and the length scale bar.
Output of one run
On macOS 14 (Apple M3 Max), Python 3.12; times vary with the machine.
wrote polyscope-viewer-output/colour_bars.png: ColourBarRanges(tension=(-0.11816166743291356, 2.1181616674329136), pressure=(0.0, 0.2521449715287928), alpha=0.05)
wrote polyscope-viewer-output/tensions_and_pressures.png
wrote polyscope-viewer-output/tensions_exploded.png
wrote polyscope-viewer-output/tensions_over_four_seeds.png (interfaces found by fewer than half of the seeds: 5, drawn in magenta)
The script
#!/usr/bin/env python
"""The Polyscope viewer from Python: tensions and pressures on the tissue, saved figures, and a seed ensemble.

foambryo's viewer draws the mesh coloured by the inferred values, with a panel that shows their colour bars, which
call produced them, a length scale bar, and controls to explode and cut the tissue, change the methods and
recompute, change the background, and export the values. Every colour is computed by the library's own colour
functions (`foambryo.colour_scales`), the ones the napari plugin uses too:

* tensions: `coolwarm`, light grey at the mean tension (1 by default), blue below, red above, over a range
  centred on the mean;
* pressures: `magma`, light for low pressures, trimmed to its 10-90 % range so that no cell is drawn black or white;
* an undetermined value (`nan`) is green, and an undetermined tension's interface is drawn as its outline; crop
  faces are see-through glass with their edges.

This example generates a foam of Voronoi cells imaged with voxels of 1.0 x 0.5 x 0.5 um (not at mechanical
equilibrium: the colours show the viewer, not the method's accuracy), and

1. writes the colour bars without any window (`save_colour_bars`: matplotlib only);
2. writes the viewer's first view of the tensions and pressures as a figure (`plot_force_inference(...,
   save_figure=..., show=False)`), then of the tensions exploded, then of tensions averaged over four
   reconstructions with their seed spread (`plot_tension_inference(..., seed_ensemble=...)`). Saving a figure
   needs Polyscope and a display; the window closes once the figure is written;
3. with `--show`, opens the same views as windows to explore (close each window to go on);
4. with `--from-mask`, opens the window on the mask itself (`view_mask`): the panel reconstructs it and infers,
   in separate processes, with their elapsed time, an estimate and Cancel. This is what `foambryo view MASK
   --spacing DZ DY DX` opens.

    pip install "foambryo[viewing]"
    python polyscope_viewer.py                   # writes ./polyscope-viewer-output/
    python polyscope_viewer.py --show            # and opens the windows
    python polyscope_viewer.py --from-mask       # the window that starts from the mask
"""

import argparse
from pathlib import Path

import numpy as np
from scipy.spatial import cKDTree

from foambryo import dcel_mesh_from_segmentation_mask, infer_forces, infer_tensions_over_seeds
from foambryo.viewing import plot_force_inference, plot_tension_inference, save_colour_bars, view_mask

SPACING_UM = (1.0, 0.5, 0.5)  # (dz, dy, dx): voxels twice as long along z, axis 0 of the mask


def generated_foam(n: int = 96, n_cells: int = 12, seed: int = 7) -> np.ndarray:
    """Voronoi cells filling a ball, on an `n`^3 grid of cubic voxels; label 0 is the medium."""
    rng = np.random.default_rng(seed)
    radius, centre = 0.46 * n, (n - 1) / 2
    seeds: list[np.ndarray] = []
    while len(seeds) < n_cells:  # well-separated seeds inside the ball
        point = rng.uniform(-0.75 * radius, 0.75 * radius, 3)
        if np.linalg.norm(point) < 0.75 * radius and all(np.linalg.norm(point - s) > 0.35 * radius for s in seeds):
            seeds.append(point)
    grid = np.indices((n, n, n)).reshape(3, -1).T.astype(float)
    _, nearest = cKDTree(np.asarray(seeds) + centre).query(grid)
    inside = np.linalg.norm(grid - centre, axis=1) <= radius
    return np.where(inside, nearest + 1, 0).reshape(n, n, n).astype(np.uint16)


def main() -> None:
    """Write the colour bars and the viewer's figures, or open the windows."""
    parser = argparse.ArgumentParser(description=__doc__.splitlines()[0])
    parser.add_argument("--output-dir", type=Path, default=Path("polyscope-viewer-output"))
    parser.add_argument("--show", action="store_true", help="also open each view in a window")
    parser.add_argument("--from-mask", action="store_true", help="open the window that starts from the mask")
    args = parser.parse_args()
    args.output_dir.mkdir(parents=True, exist_ok=True)
    mask = generated_foam()[::2]

    if args.from_mask:
        view_mask(mask, SPACING_UM, spacing_unit="um")
        return

    mesh = dcel_mesh_from_segmentation_mask(mask, spacing=SPACING_UM)
    tensions, pressures = infer_forces(mesh)

    ranges = save_colour_bars(mesh, tensions, pressures, args.output_dir / "colour_bars.png")
    print(f"wrote {args.output_dir / 'colour_bars.png'}: {ranges}")

    plot_force_inference(mesh, tensions, pressures, length_unit="um",
                         save_figure=args.output_dir / "tensions_and_pressures.png", show=args.show)
    print(f"wrote {args.output_dir / 'tensions_and_pressures.png'}")
    plot_tension_inference(mesh, tensions, scattered=True, scatter_coeff=0.5, length_unit="um",
                           save_figure=args.output_dir / "tensions_exploded.png", show=args.show)
    print(f"wrote {args.output_dir / 'tensions_exploded.png'}")

    ensemble = infer_tensions_over_seeds(mask, seeds=range(4), spacing=SPACING_UM)
    plot_tension_inference(mesh, seed_ensemble=ensemble, length_unit="um",
                           save_figure=args.output_dir / "tensions_over_four_seeds.png", show=args.show)
    print(f"wrote {args.output_dir / 'tensions_over_four_seeds.png'} (interfaces found by fewer than half of the "
          f"seeds: {sum(ensemble.found_by_fewer_than_half_the_seeds.values())}, drawn in magenta)")


if __name__ == "__main__":
    main()